Project 2: Elastic Collection
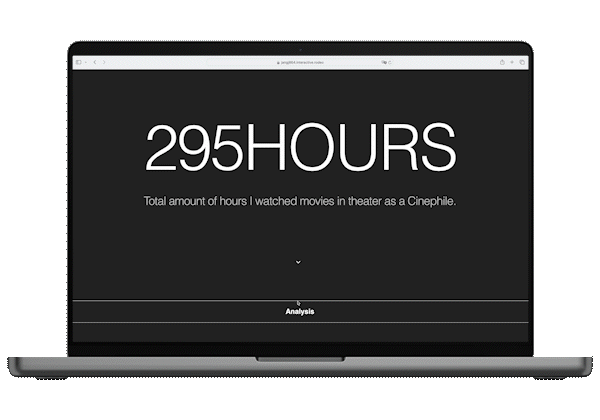
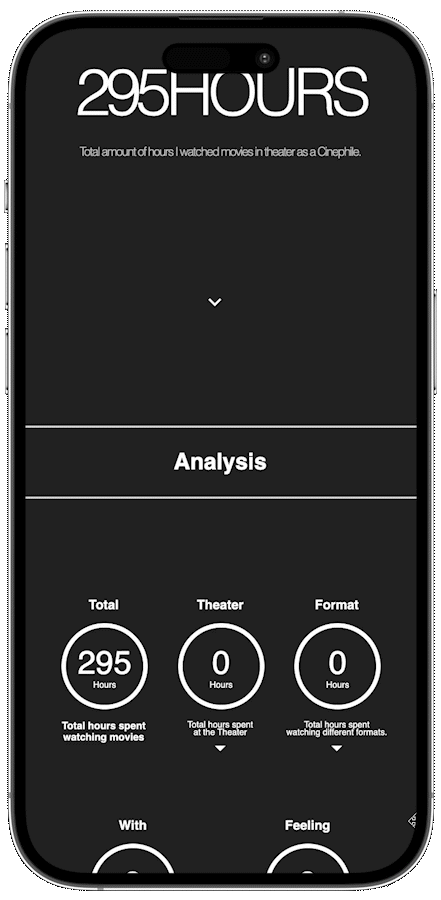
This topic had data about the movies I visited and watched. The title of this web page, '295 hours', is the total number of hours watched.
The color is a white font on a black background. Monochromatic colors were used to create a movie theater feel and movie ending credits style design.
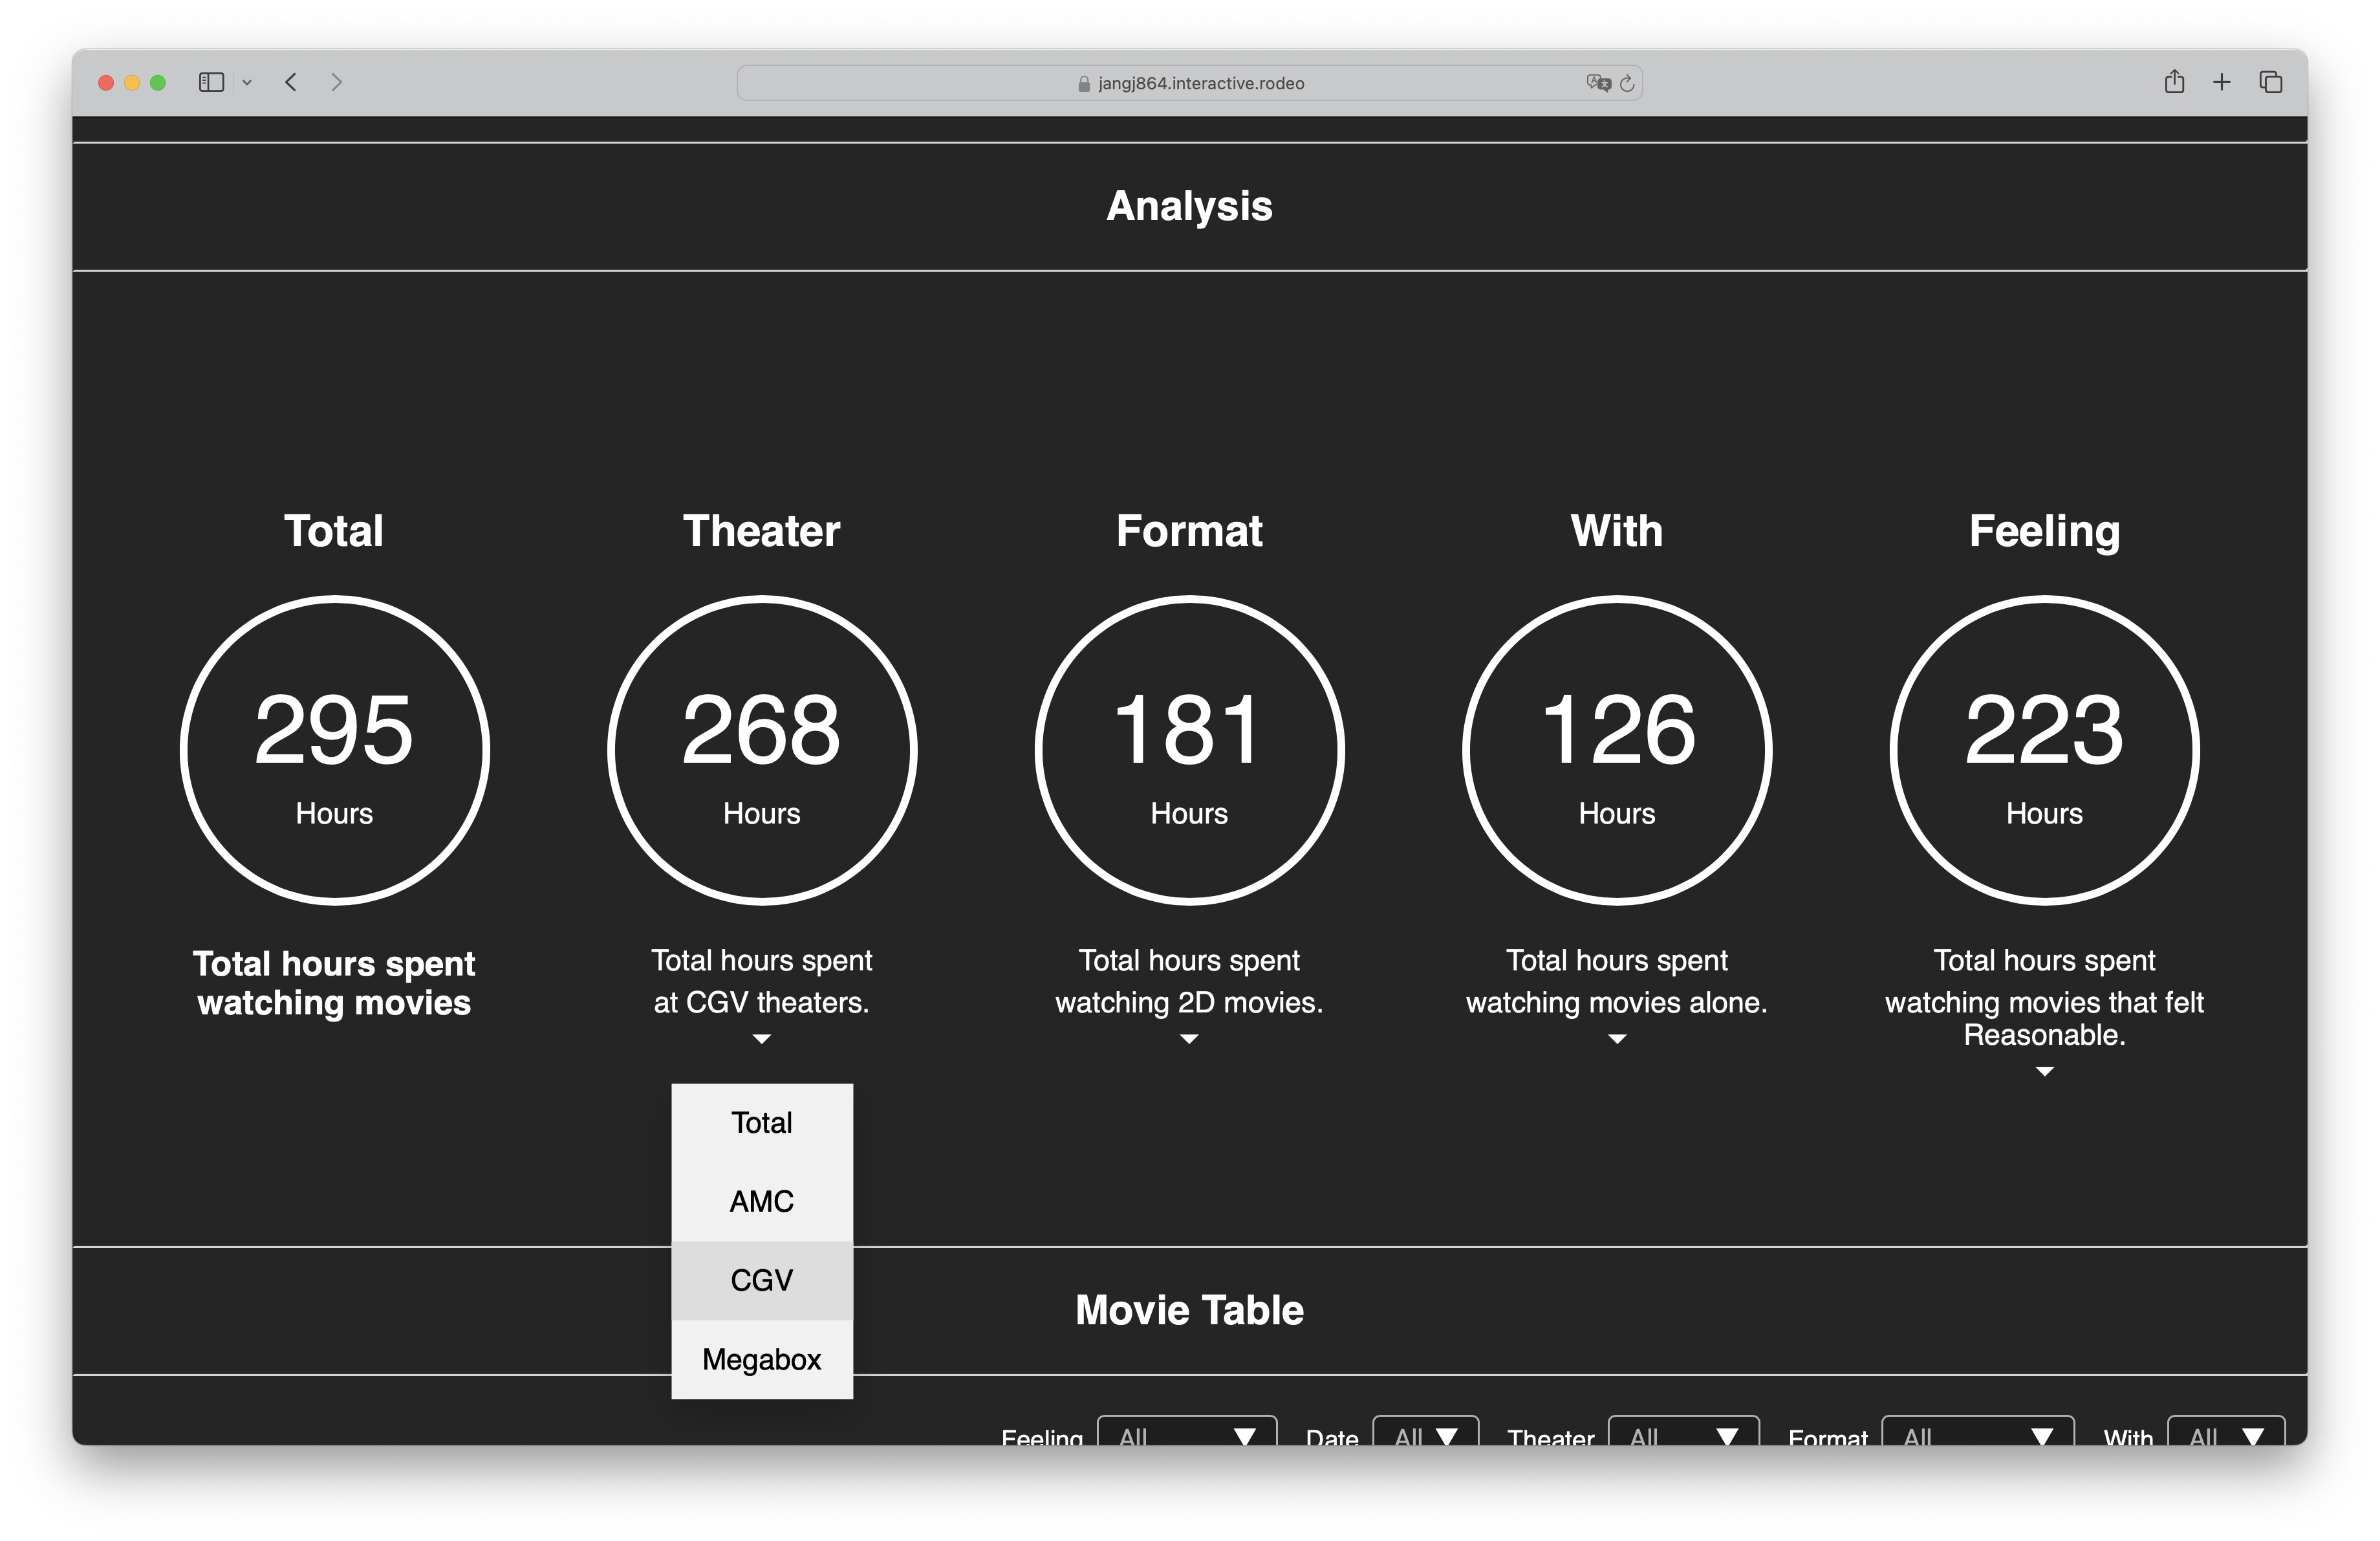
Each of the five circular diagrams placed side by side is Analysis about Total amount of time, Total time classified by theater, Total time classified by format,Total time categorized by people who watched it together, It shows the numbers for the total time I spent categorizing my feelings about my experience after watching the movie.
At the top of the table, select the desired item from the category bar, only data corresponding to that item can be compared. Duplicate selection is also possible.
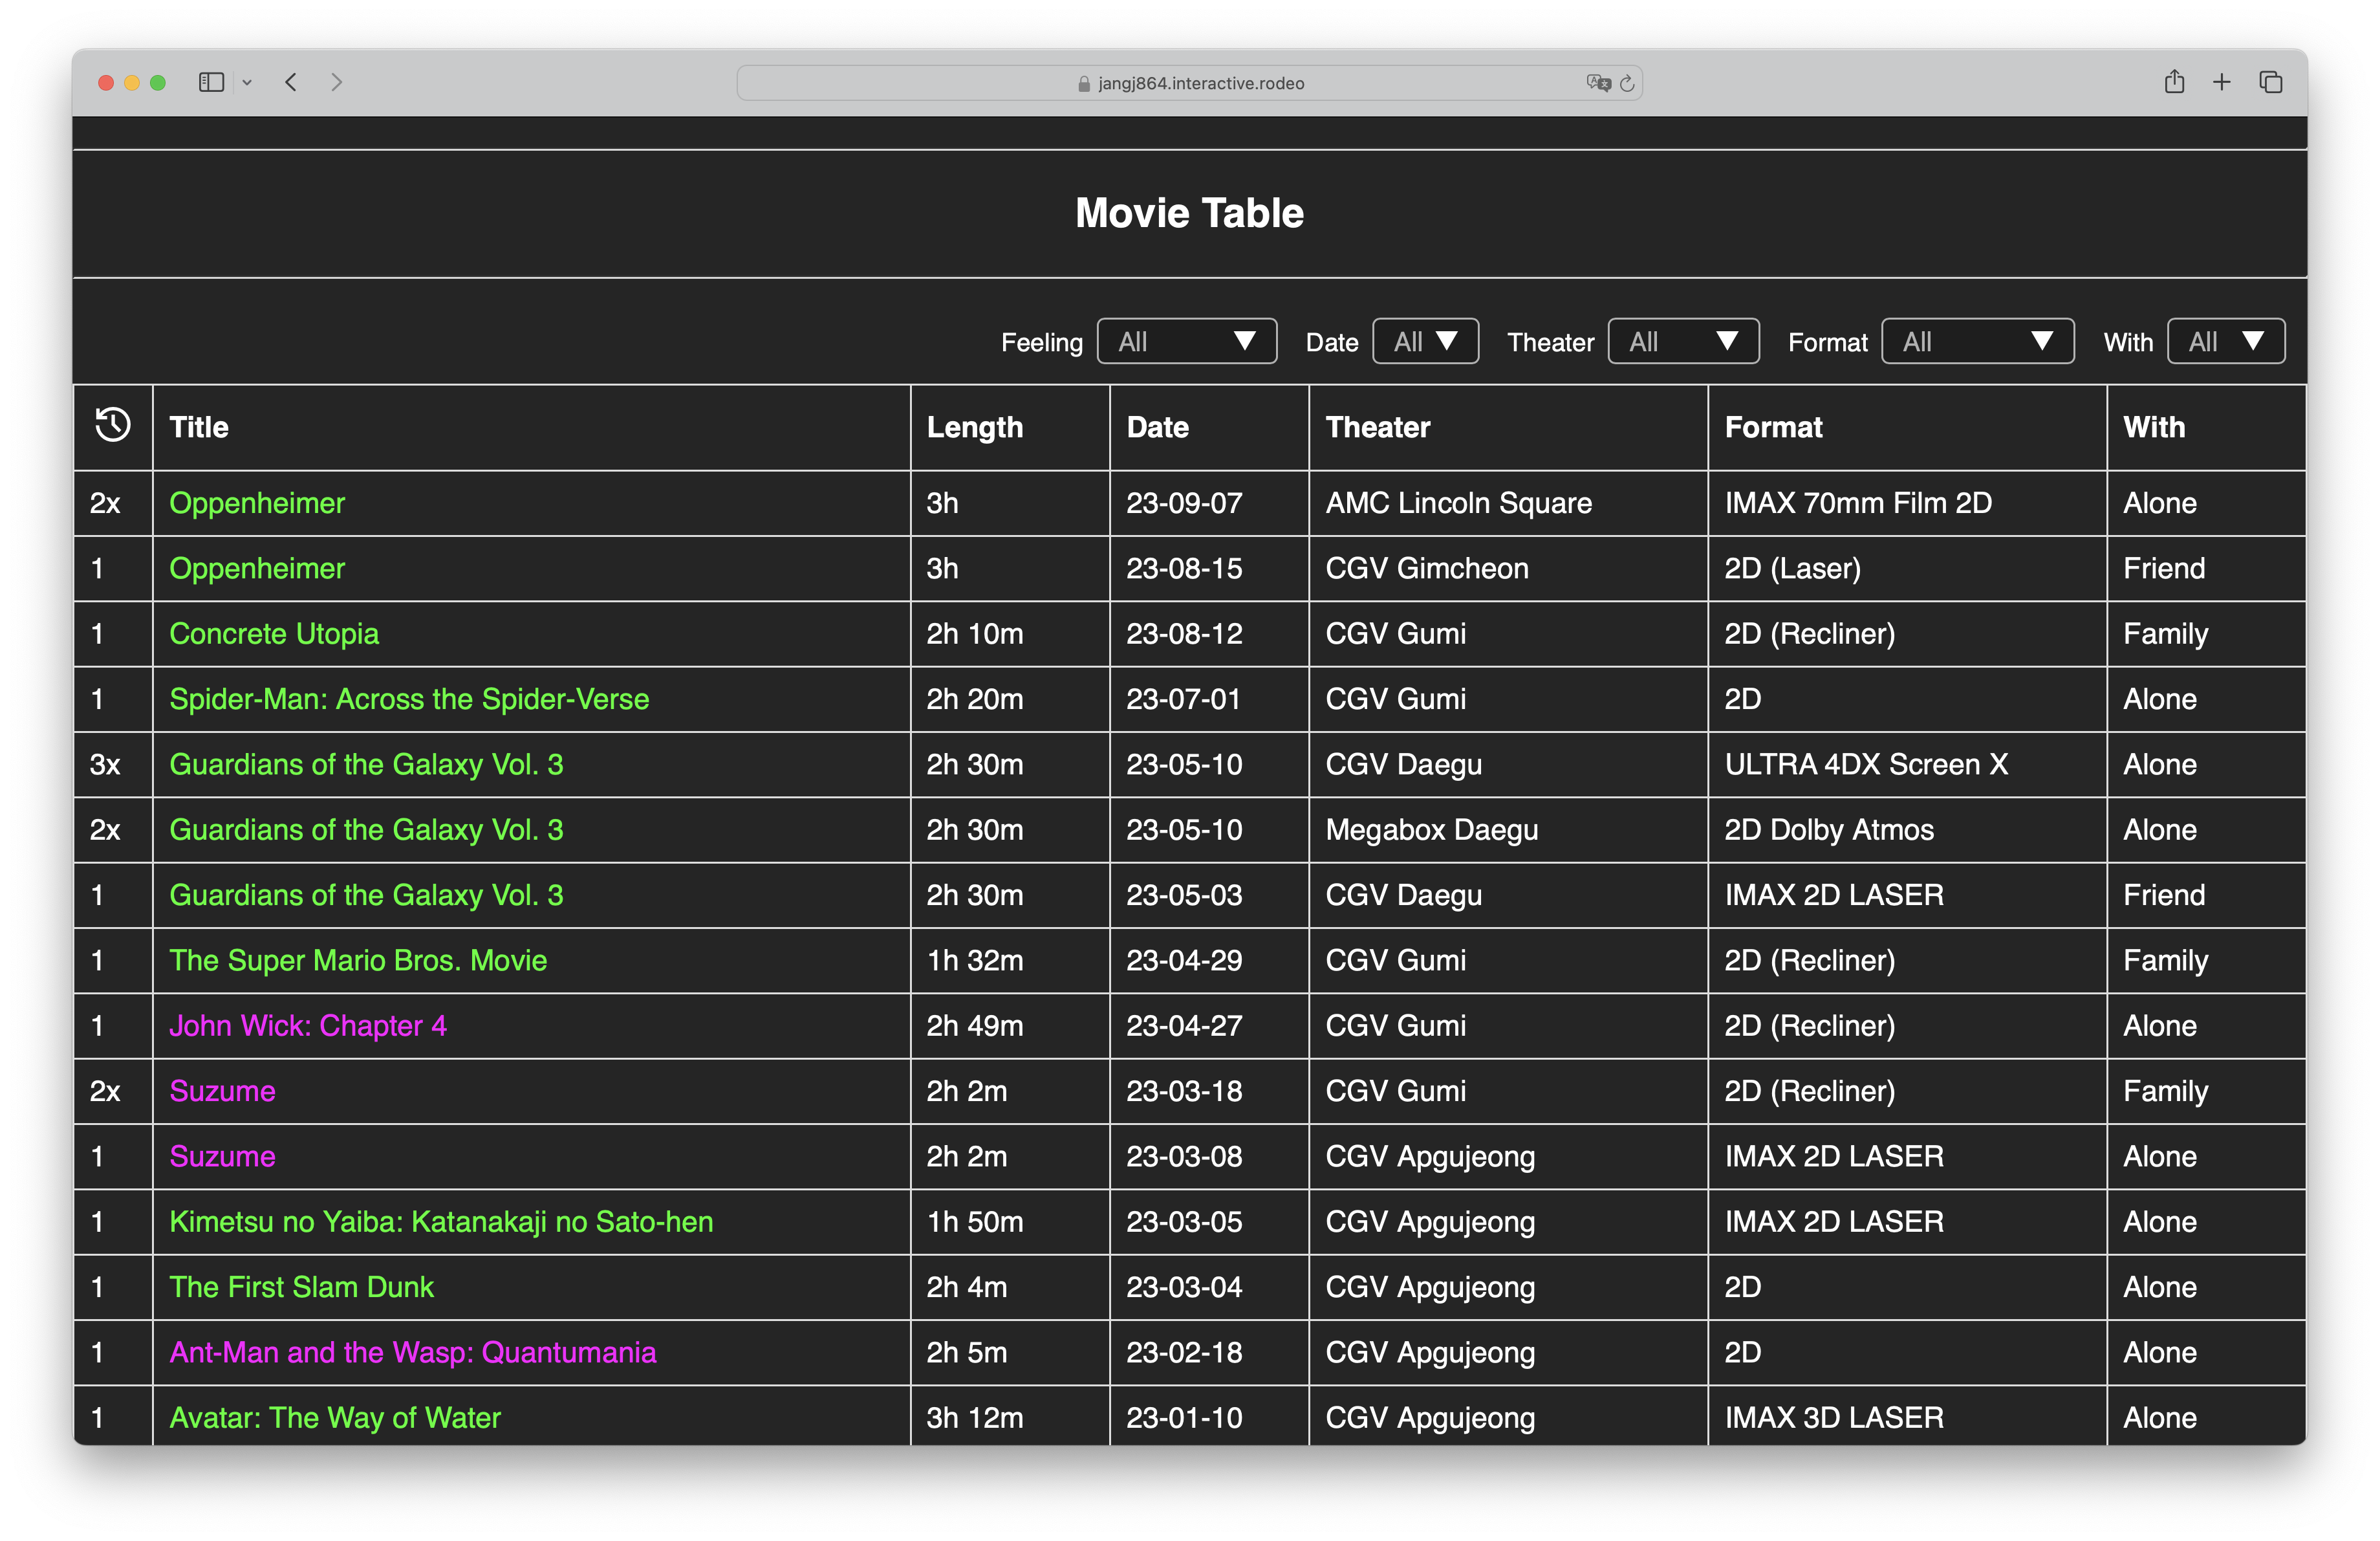
On the left of the table, the number of times the movie has been watched is written in numbers.
The movie titles next to it are in green for Reasonable and purple for Regrettable.
Each letter represents Each person’s perspective color and it links into their own index.