Project 3: New York City In Data
This is a webpage created using Real-Time Data. It was based on an event called ‘Advancing Equitable and Resilient Futures in NYC: Science and Policy for Climate Justice’ held in The New School. This topic was created to focus on Climate risk projections. Contexts are related in extreme climate change.
Using Open Weather's Real-Time data API.
Data from WindSpeed, Precipitation, Humidity, and Temperature were utilized, and the real-time situation of each data is reflected interactively on the web page.
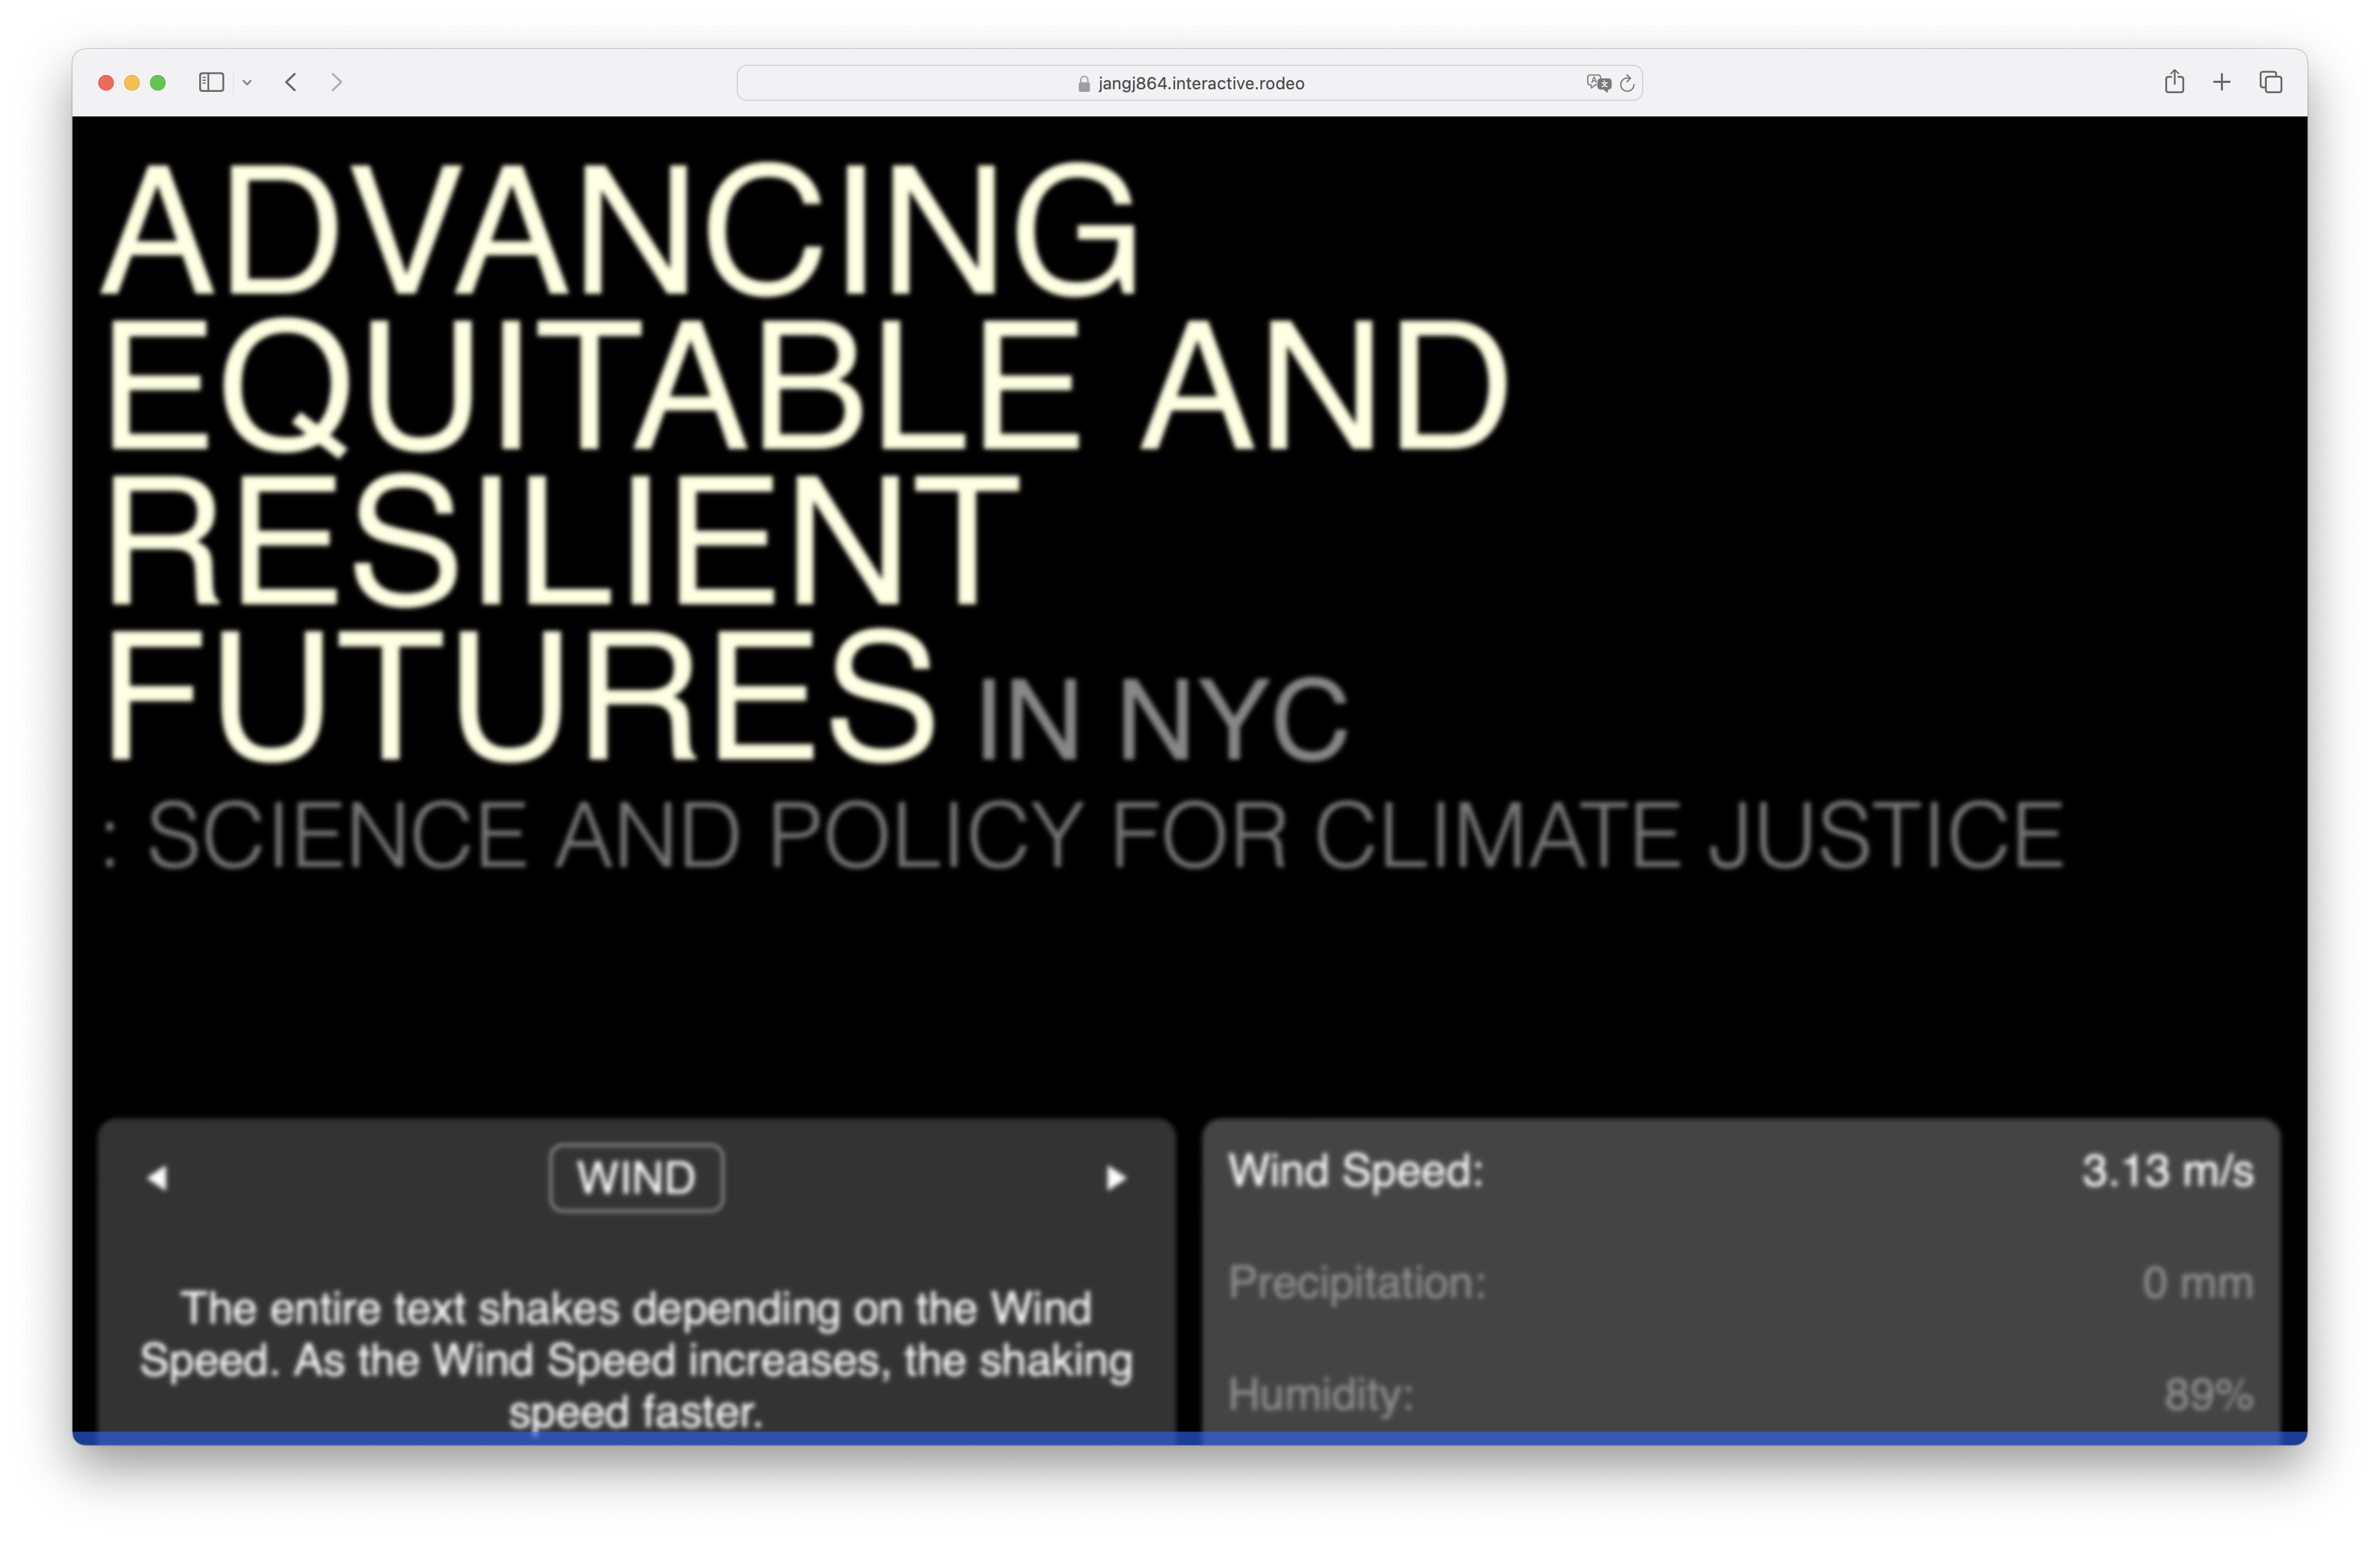
The function of each element is indicated at the top of the page.
You can check detailed information by clicking the triangle-shaped arrows to the left and right of the data name, clicking the indicator below, or clicking the data text on the right.

The entire text shakes depending on the Wind Speed. As the Wind Speed increases, the shaking speed faster.
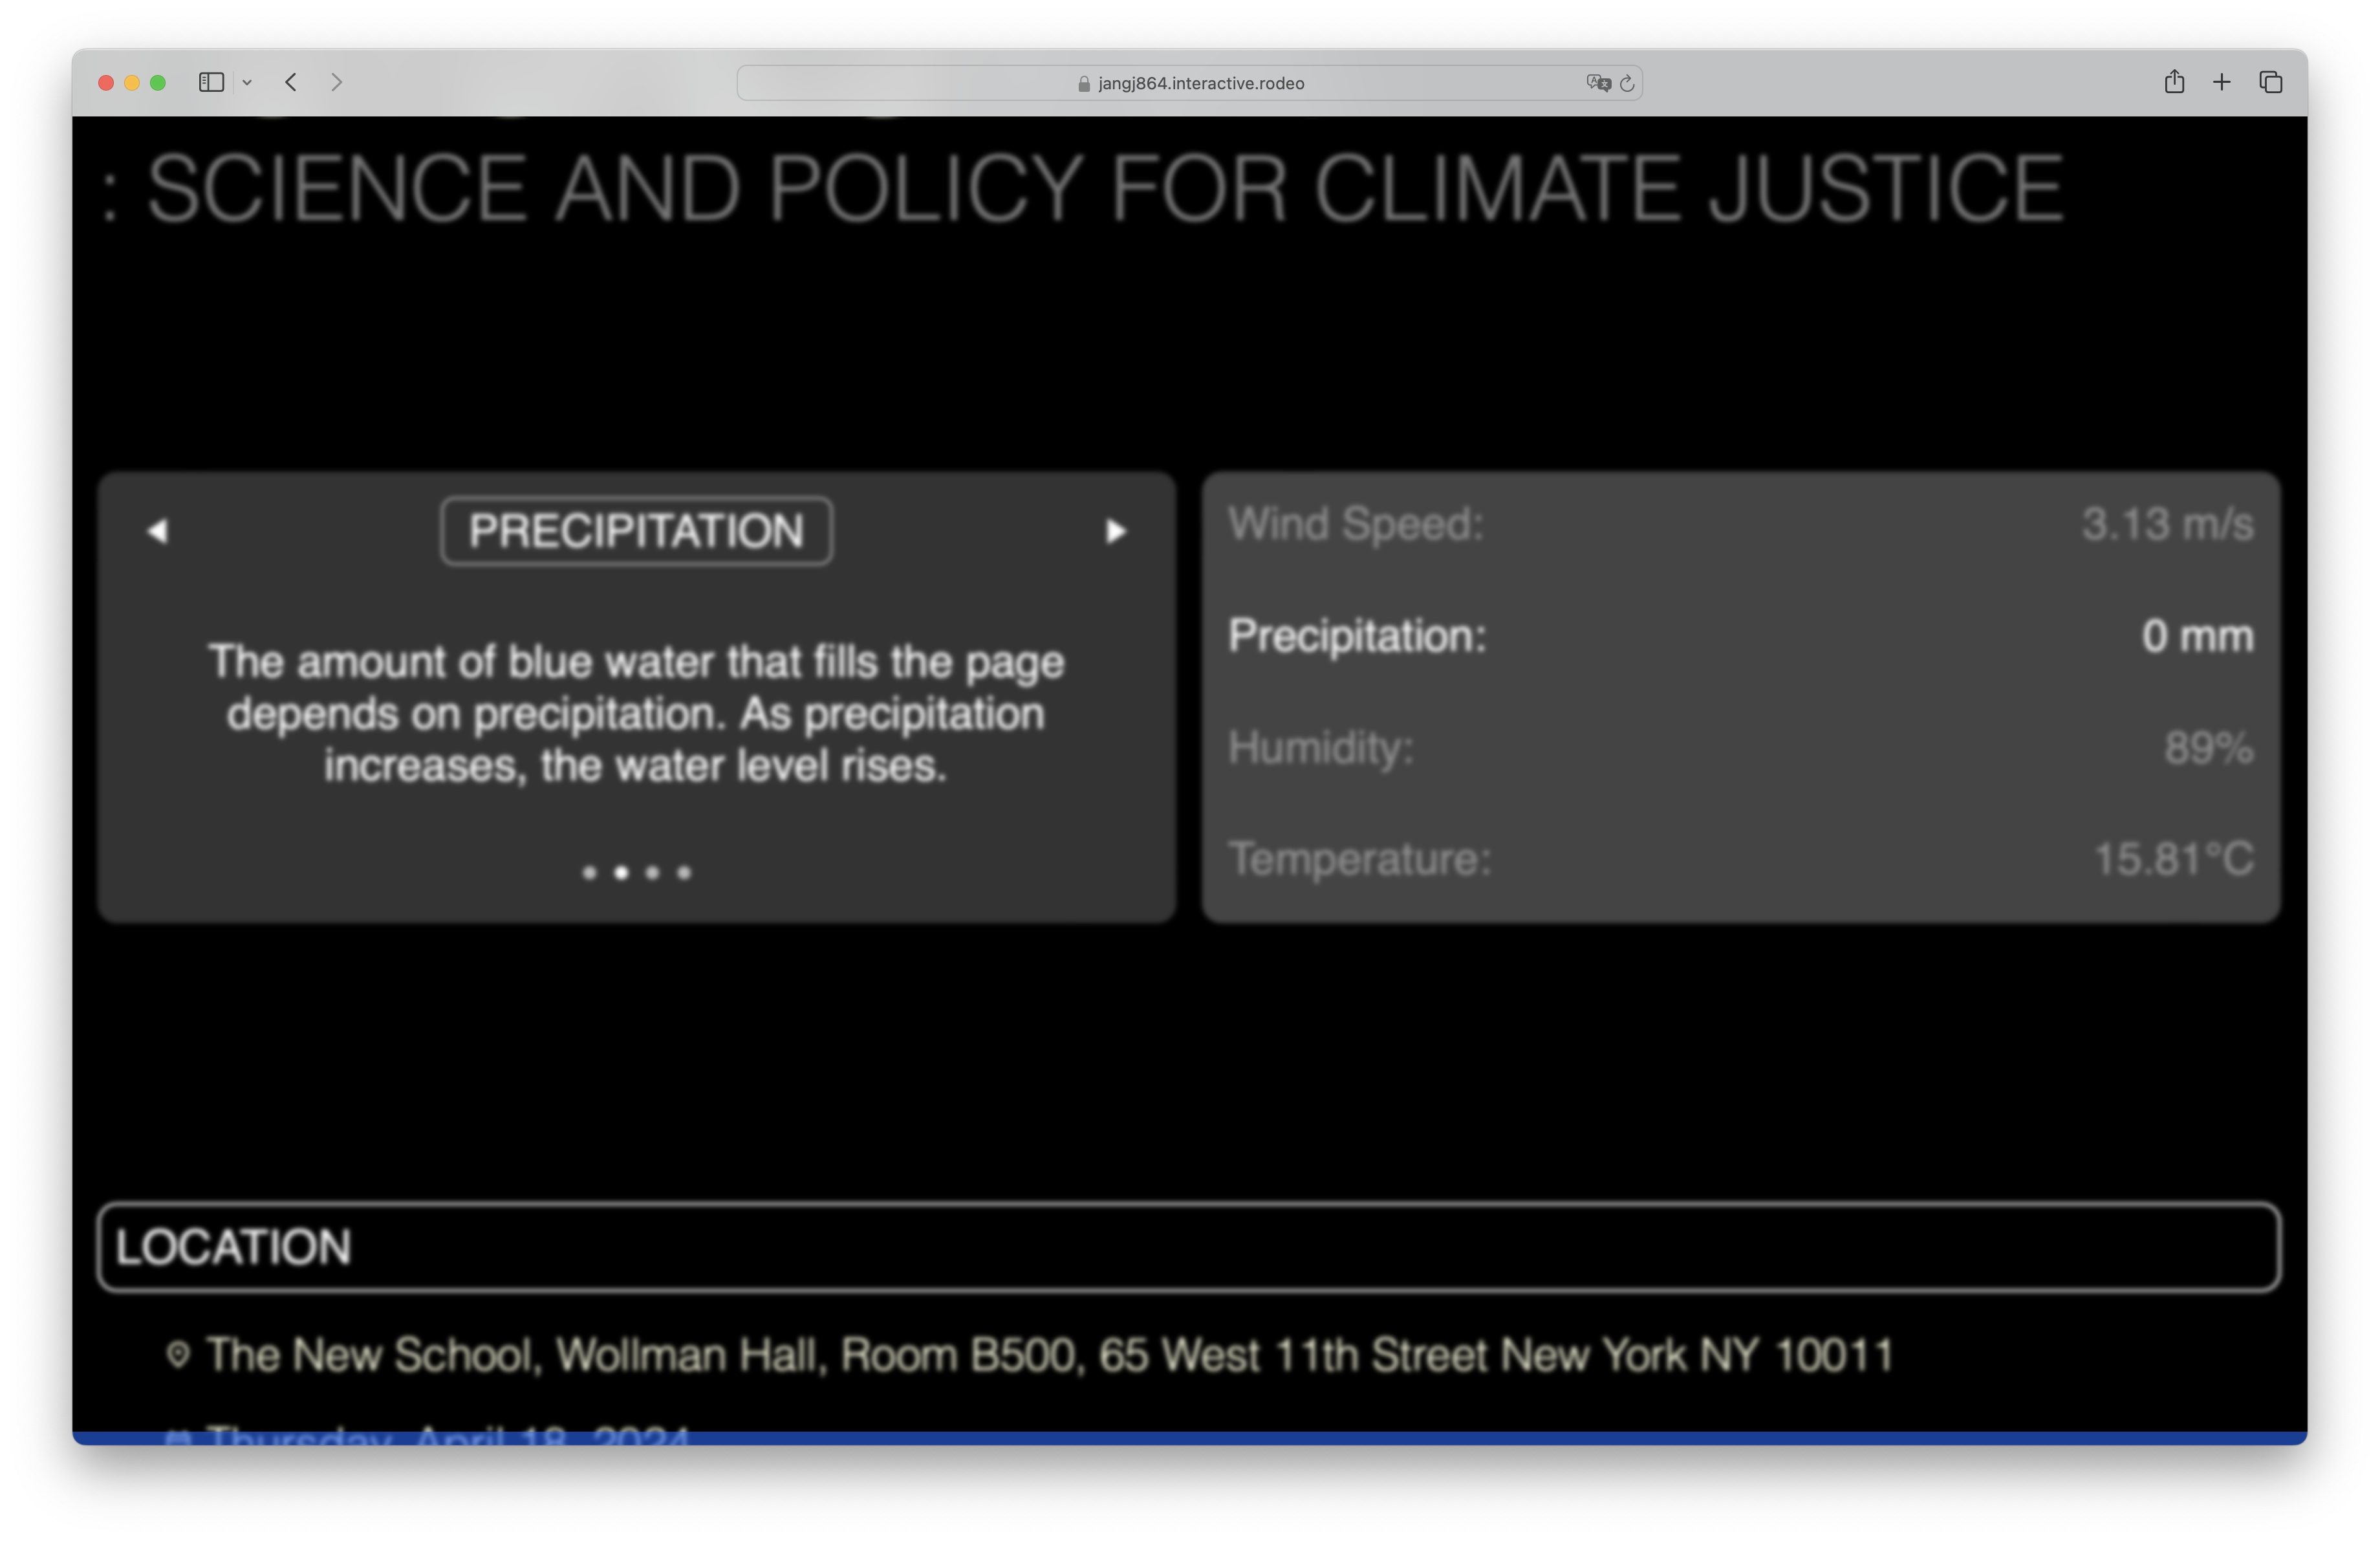
The Blue water fills the page depends on precipitation. As precipitation increases, the water level rises.
Depending on the level of Humidity, moisture accumulates on the page. As the Humidity rises, text get blurred.
The color of the text changes depending on the Temperature. They are White, Pale Yellow, Yellow, Orange, and Red.
On the mobile screen, the placement of the API description changes.